Generating Colour Mandelbrot Images
.ppm.
For example, a 2 x 2 image with pixels red, white, black, blue (reading left to right and top to bottom) is:
P3
2 2
255
255 0 0 255 255 255
0 0 0 0 0 255
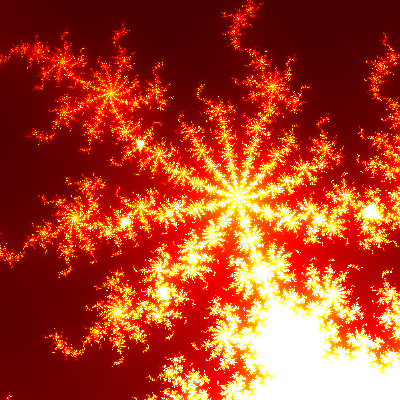
One possible way to map escape iterations to color is to scale the values and treat the first third as "x 0 0", the next third as "255 x 0" and the final third as "255 255 x". This will produce a gradient from black to red to yellow to white. You might want to experiment with some different escape iteration -> colour mappings and see the type of images they produce.
You can change the region of the set that is drawn by adjusting the grid boundaries in the complex plane. As the Mandelbrot set has unbounded complexity, you can "zoom in" to the fractal and discover more interesting patterns. The edges of the set are rich with pretty pictures. This image was produced with the colouring scheme described above after adjusting the region being plotted to locate a good-looking part of the set:
If you want to keep any of your Mandelbrot images it is recommended you recompress them to a more efficient storage format, as PPM and PGM are designed for simplicity rather than storage efficiency. PNG is a good choice as it is lossless (so the image will be identical to the one you generated from your program). To perform the conversion you can use the convert program on the command line:
convert generatedimage.ppm newimage.png