
C++
Exercise 3
TASK DESCRIPTION
 In this exercise you will write a C++ program that approximates the Mandelbrot set. The Mandelbrot set is a well-known fractal in the complex plane with a simple rule for set membership that results in a shape of unbounded complexity.
Your program will generate output directly to a file in the Portable Gray Map (PGM) format, which you can view with any image viewer (such as display at the command line). You will also count the number of tested locations that 'pass' the membership test, and output this result to the console.
A complex number c is a member of the Mandelbrot set if xi remains bounded, for all i, under this iteration:
x0 = 0
xi+1 = xi2 + c
It is known that if a point ever goes outside of radius 2 in this iteration, it will escape to infinity.
Consider, as an example, the point c = 0.5 + 0.5j :
x0 = 0
x1 = c
x2 = x12 + c = 0.5 + j x3 = x22 + c = -0.25 + 1.5j x4 = x32 + c = -1.6875 - 0.25j x5 = x42 + c = 3.28516 + 1.34375j
We have |x5| > 2, so the point escapes after 5 iterations, and is not a member of the set.
You will approximate the test of Mandelbrot set membership for a complex number c by performing the iteration until the value exceeds the escape radius, or a fixed maximum number of iterations is reached. If the maximum number of iterations is reached without xi escaping, you will consider c a member of the set.
Your task is to write a program that performs the Mandelbrot iteration on locations in a regular grid in the complex plane, in the square region [-2,2] + [-2,2]j. You should output to a file, in the format described below, an image depicting the number of escape iterations for every grid element, and you should also output to the console the number of locations in the grid that remain bounded for the maximum number of iterations.
Step1: COMPLEX NUMBERS
A complex number can be represented by two real numbers: real component and the imaginary component. Recall that complex numbers add component-wise and multiply as polynomials, with j2= -1:
(a + bj) · (c + dj) = ac + adj + bcj + bdj2 = (ac - bd) + (ad + bc)j
The magnitude of a complex number is the Euclidean norm of its components:
|a + bj| = (a2 + b2)½
Note that for checking if a complex number is within a certain radius r of the origin, you can check whether its squared magnitude is less than r2 (no square root operation is necessary).
Write a function to calculate the number of iterations after which a point escapes and test it with the example in the task description above.
You may wish to use the following function prototype:
int escape_iterations(double c_real, double c_imag, int max_iterations)
{
   // ...
}
Step2: SAMPLING THE GRID
To compute the complex number c corresponding to a row and column of the grid, find the real (horizontal) component from the column index and the imaginary (vertical) component from the row index. If x is the real component of c, then at column 0, x = -2.0, and at the last column (width-1), x = 2.0. The same is true for the row index (replacing width by height). From these boundary cases you can deduce the general formula to convert the row and column indices to c.
For instance, for an image of width 9, the real component of c should take on the the following values:
| Column index | 0 | 1 | 2 | 3 | 4 | 5 | 6 | 7 | 8 |
| x | -2 | -1.5 | -1 | -0.5 | 0 | 0.5 | 1 | 1.5 | 2 |
Write code to sample the grid. Test your code by outputting the complex numbers to be sampled for a 9x9 grid and compare to the values in the table above.
Step 3: IMAGE OUTPUT
The PGM plain-text output format for grayscale images starts with a simple header, followed by pixel intensity values. The header for an image with 400 columns and 300 rows, with intensity values in [0,255] is:
P2
400 300
255
Following the header are the pixel values in raster scan order (first row, left to right, then second row, etc.). The values are normal decimal numbers in plain ASCII text, separated by white space. For example, the following specifies a complete 8x8 image, with intensities in the range [0,9], which you can write to a file with .pgm extension and view in an image viewer:
P2
8 8
9
7 7 7 7 7 7 7 7
7 3 3 0 0 3 3 7
7 3 9 0 0 9 3 7
7 0 0 0 0 0 0 7
7 9 0 0 0 0 9 7
7 2 9 9 9 9 2 7
7 0 2 2 2 2 0 7
7 7 7 7 7 7 7 7
N.B. This example image is only 8 pixels by 8 pixels (i.e. tiny).
To write output directly to a file, you should use the ofstream ('output file stream') object, defined in the fstream header. This code writes a black image to test.pgm:
#include <iostream>
#include <fstream>
using namespace std;

int main()
{
    ofstream file("test.pgm");  // open the output stream

    const int width = 10;
    const int height = 10;
    const int max_intensity = 255;

    // Write the PGM header
    file << "P2" << endl << width << " " << height << endl << max_intensity << endl;

    // Go through in raster order (row by row)
    for (int row=0; row<height; ++row)
    {
        for (int col=0; col<width; ++col)
        {
            // Output the intensity value of the pixel at row, col
            file << 0 << " ";
        }
        // Put an end-line at the end of each row
        // (not required by PGM, but makes it easier to check the output)
	file << endl;
    }
    cout << "This text will appear on the console" << endl;

    // The file will be automatically closed at the end of main().
}
Write a program to generate an image of the mandlebrot set. Your program should ask for the image width and height and the maximum number of iterations to be applied to a complex number before it is assumed that it lies within the set. Your program should also ouput the number of points on the grid that fall within the set.
The simplest way of generating an image of the Mandelbrot set is to use the maximum escape iteration count as the maximum intensity value, and to use the number of iterations for each grid point as that pixel's intensity.
TESTING
For width = height = 10, with maximum 16 iterations, there should be 10 locations passing the test. If you raise the maximum iterations to 255, only 8 will pass the test.
Here are some combinations of width, height, and maximum iterations, and the pass count you should get for each:
| Width | Height | Max Iter. | # Pass |
| 10 | 10 | 16 | 10 |
| 10 | 10 | 255 | 8 |
| 32 | 16 | 100 | 42 |
| 100 | 100 | 200 | 932 |
| 100 | 100 | 1000 | 914 |
| 200 | 200 | 1000 | 3732 |
| 200 | 200 | 64 | 3886 |
Using the parameters in the last row, and using the escape iteration count for each location as the intensity value, you should get an image that looks like this:
Run your program with width 500, height 500, and maximum iterations 255. Make a note of the console output (number of points passing all iterations).
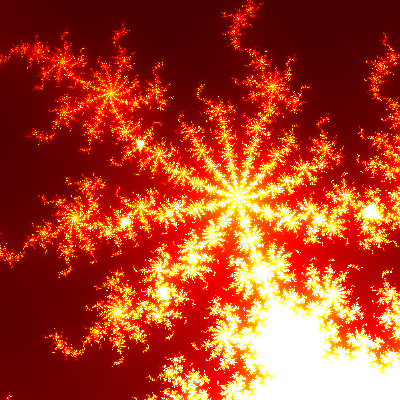
OPTIONAL: PRETTIER PICTURES
You can make the image output more interesting by changing the mapping from escape iterations to intensity value. For instance, what happens if you map all even escape iteration counts to zero intensity and all odd ones to the maximum intensity? If you want to generate more interesting colour images without much effort, see the Generating Colour Mandelbrot Images page.
- On to Exercise 4
- Back to the main 1B C++ page