
Big Processes - Memory issues
 When processes get big (dozens of Megabytes),
specialised knowledge about memory usage can help you reduce the process's
"memory footprint" - a good idea because
When processes get big (dozens of Megabytes),
specialised knowledge about memory usage can help you reduce the process's
"memory footprint" - a good idea because
- On some systems, processes won't run if they're too big. Various limits can be reached.
- Smaller processes are likely to run faster than big ones.
Preliminary investigation
The size of a compiled program on disk is not always a good indication of how big the resulting process will be when the program runs, and processes can grow as they run, so a useful first step is to monitor the process size.
On Windows try running the "Task Manager" (right-click on an empty part of the task bar). The administrator might have disabled it though.
On Unix machines you can use top, which every few seconds updates a screen of information like the following
 It's the SIZE and RES columns that you need to look it.
If the numbers keep increasing, there may be a "memory leak" in the
program's loops. If the numbers are bigger than expected, it's worth trying
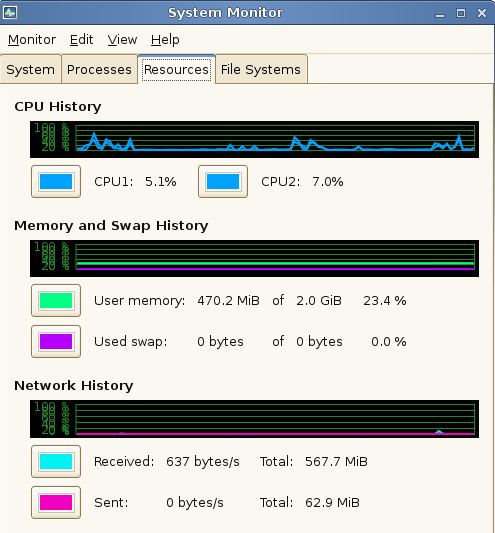
to slim down your program. If you want something more graphical than top use
It's the SIZE and RES columns that you need to look it.
If the numbers keep increasing, there may be a "memory leak" in the
program's loops. If the numbers are bigger than expected, it's worth trying
to slim down your program. If you want something more graphical than top use  on our Teaching System
Address space limits
If your processes are approaching 2GB in size, you might be in trouble. By definition, a 32-bit processor uses a 32-bit number to refer to the location of each byte of memory. 2^32 = 4.2 billion, which means a memory address that's 32 bits long can only refer to 4.2 billion unique locations (i.e. 4 GB). The 4GB limit is a theoretical limit - in practise programs won't be able to use that much on 32-bit machines. For example, with most versions of Windows 2GB is dedicated to kernel usage, and 2GB left for applications. Each application gets its own 2GB, but all applications have to share the same 2GB kernel space. You can change that by setting the 3GB switch in the boot.ini file so that 3GB is allocated to applications
A 64-bit processor can address more memory than you'll ever need.
Swap space limits
A 1G program doesn't need 1G of RAM (though it will help with speed!). It does however need 1G of "backing store" (otherwise known as "swap space") - an area on disc reserved for storing parts of processes that aren't being used. It's unlikely that Swap space limits will cause you problems - nowadays there's usually enough.
Kernel limits
The system manager sets various limits when configuring a system. On most unix systems
will tell you what the limits are. Users might not have control over these limits. The information below refers to the teaching system's HP-UX machines, but other Unix systems are similar.
- maxdsiz (640 Mb) - maximum data segment size - static data, strings, arrays in main, malloc/new variables
- maxssiz (80 Mb) - maximum dynamic storage segment - stack (local vars, parameters passed to functions, etc)
- maxtsiz (640 Mb) - maximum shared-text segment size - program storage (read-only)
Note that different limits may be exceeded depending on how variables are used and created. E.g.
- C's "malloc" and C++'s "new" get memory from "the heap" in the data area. If you create a local array in a function, the memory for the array comes from the dynamic storage area, which usually has less memory available.
- You sometimes have control over which which areas of memory will be used. For example, the HP-UX Teaching System's f90 has a "-K" option which makes the program "Use static storage for locals instead of stack storage."
- Using recursion or passing giant arrays by value to functions will use up stack space.
Your code
You may not be able to increase the kernel limits, but you probably can reduce the memory requirements of your process. Sometimes this may require the CPU working harder, but if this means that your process will access the disc (backing store) less, your program is likely to run faster overall. Look at the big arrays first
- C++
Reduce the size of data-types if you can. Don't use double if a char will do. You may need to experiment with structure sizes - compilers tend to pad structures so that they're a multiple of 4 or 8 bytes, so sometimes you need to be more cunning than just changing "int" to "char". The saving in space is considerable though.
Rather than use 32 ints to store 32 yes/no values, you can use one 32-bit int, using each bit as a flag. The following code (which has no error checking!) shows how to do this using a new C++ facility or an older C method that also works in C++.#include <iostream> #include <bitset> using namespace std; void set_a_bit(uint whichbit, uint& variable, int value) { if (value!=0 and value!=1) return; uint mask=1<<whichbit; if (value==1) variable|=mask; else variable&=~mask; } bool get_a_bit(uint whichbit, uint variable) { uint mask=1<<whichbit; uint v= variable & mask; return (v!=0); } int main() { const unsigned int width = 32; bitset<width> b2 = 1023; // here's a C++ method. See the bitset documentation for details cout<< b2.count() << " bits set in b2" << endl; uint foo= 2; // here's a C way of accessing bits cout << "Bit 0 in foo is " << get_a_bit(0,foo) << endl; cout << "Bit 1 in foo is " << get_a_bit(1,foo) << endl; cout << "Bit 2 in foo is " << get_a_bit(2,foo) << endl; set_a_bit(3,foo,1); cout << "foo is now " << foo << endl; return 0; } - Matlab
By default, matlab arrays have elements each using 8 bytes, so
big = zeros(1000,1000);uses 8 million bytes. If each element need only store a small integer, you could uselittle = zeros(1000,1000,'int8');and save 7 million bytes. If your arrays are "sparse", use Matlab's sparse arrays to save even more memory. For example,tiny=speye(1000);creates a 1000x1000 identity matrix that takes up only 16004 bytes.
To reduce the memory requirements of matlab you can start it without Java support (for example, by using -nojvm option from the command line)
Advanced diagnosis
Once you've tried dealing with arrays you may need guidance to decide what to do next. Profiling is used to deal with time-optimisation. Tools also exist to help with memory-optimisation. One example is Valgrind which works on x86-based linux systems. It includes
- Memcheck
which can detect
- Use of uninitialised memory
- Reading/writing memory after it has been free'd
- Reading/writing off the end of malloc'd blocks
- Reading/writing inappropriate areas on the stack
- Memory leaks - where pointers to malloc'd blocks are lost forever
- Mismatched use of malloc/new/new [] vs free/delete/delete []
etc. If the following program is compiled to produce a program called
testing#include <stdlib.h> #include <stdio.h> #include <string.h> int main() { char *str1=(char*)malloc(5); char *str2=(char*)malloc(5); strcpy(str2,"four"); strcpy(str1,"twelve bytes"); printf("str1=%s\n", str1); printf("str2=%c\n", str2); }then
valgrind testing
will produce a lot of output, including things like
Address 0x1BB50034 is 7 bytes after a block of size 5 alloc'd ... LEAK SUMMARY: definitely lost: 10 bytes in 2 blocks.etc. - Massif: a heap profiler
which will produce graphs that give an overview of how your program uses
memory, and how that varies over time. The data files give further
details. Run it by doing
valgrind --tool=massif testing