 |
Department of Engineering |
 |
|
Debugging
Introduction
|
In Code Complete it notes that "the industry average for code production is
8-20 lines of correct code per day". It's not uncommon for over 50% of programming time to be spent on
debugging, and yet the same book says that "experience suggests that there are 15-50 errors per 1000 lines of
delivered code" and some expensive bugs have been documented. Testers are important enough to get credits nowadays on computer projects (especially with computer games).
|
|
This document looks at various techniques and utilities (particularly
ddd on the Teaching System) that aid debugging. Note that debuggers
like ddd can only be used if your
program already compiles.
 The bigger a program becomes, the bigger the benefits of early bug detection.
Pessimistic programming and in-built testing procedures save time
in the end. Don't leave testing to the last moment - test each component as
you go along. Dealing with a sequence of independent bugs is much easier than
fixing inter-related bugs.
The bigger a program becomes, the bigger the benefits of early bug detection.
Pessimistic programming and in-built testing procedures save time
in the end. Don't leave testing to the last moment - test each component as
you go along. Dealing with a sequence of independent bugs is much easier than
fixing inter-related bugs.
Take advantage of what your computing language offers. More recent versions
of Fortran and C/C++ offer facilities designed to replace older, more
bug-prone methods, and compilers have options that can warn you about legal
though suspicious aspects of your code. Read your compiler's documentation.
Each language has its own commonly made errors. See the language sections
of this document for details. Some general points are
- Assume when you're writing your program that it won't be bug-free.
Write it so that
you (and others) can easily debug it: make routines small and control
flow simple.
- Write defensive code. Always assume the worst. Check return values.
- It's not uncommon for beginners to prove to themselves on paper
that their code is correct, even though it's not. Add print statements
to print out intermediate values and test assertions.
- If you're using floating point arithmetic, check divisions to see
if you're dividing by zero.
- Check that you're not going off the end of arrays.
- Reduce the scope of your bug search. If you run your program and it
seems to do nothing (but doesn't crash or finish) what is it doing? Is it working
hard on a calculation, is it waiting for input or is it stuck in a loop?
Use "print" statements to see how far the program gets
- Debugging becomes laborious if you print out too much diagnosic
information and mix it with the usual output. With C++ it helps to use
cerr for error messages instead of using cout.
By default, cerr output goes to the same place as cout
output, but you can separate the streams. For example
program 2> foo
will run the program sending all the cerr output to a file called
foo. Also cerr isn't buffered, so you see the output straight away.
The following program (called average.cc) was meant to print out the mean of 1, 2, and 3.
#include <iostream>
using namespace std;
int average(int num[]) {
int total;
for (int i=0;i<=3; i++)
total=total+num[i];
cout << "Average is " << total/3 << endl;
}
int main() {
int n[3]={1, 2, 3};
average(n);
}
When I run this program I get
Average is -403085996
Staring at the code long enough might help you detect the bug, as might
adding some cerr statements. Here I'll show how to use the debugger
we have on the Teaching System (it's called ddd -
other debuggers behave similarly)
ddd is a debugger for C, C++ and Fortran code that gives you
control
over execution of a program, allowing you to step through a program
line by line and check the values of variables. The ddd commands are
the same whichever of the languages the suspect program is
written in.
Before you can use ddd on a program, you have to compile with
a `-g' flag.
g++ -g -o average average.cc
Then type ddd average. A window will appear showing the
source code and some menus.We are
going to run the program a line at a time. If you press with the right-button
on the word main, you'll get a menu.
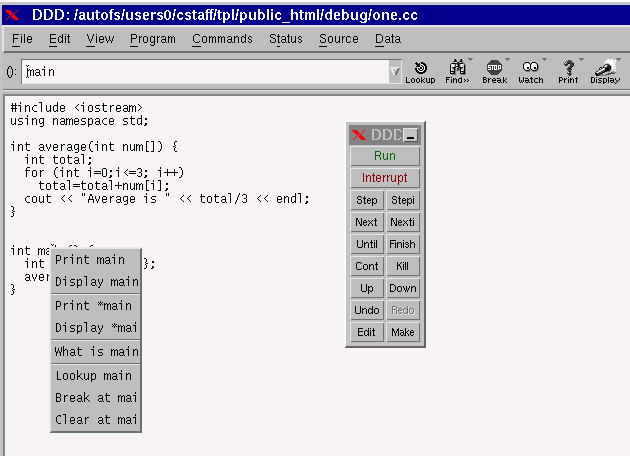 Select the "Break at mai[n]" option. This will make execution stop when it
reaches the main routine. Then click on "Run" in the DDD floating
panel.
Select the "Break at mai[n]" option. This will make execution stop when it
reaches the main routine. Then click on "Run" in the DDD floating
panel.
| A green arrow will appear, showing which line is about to run.
Execution has stopped at the breakpoint we set. Click on "Step" in the DDD floating
panel.
|
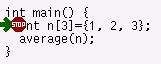 |
Notice
how the arrow moves onto the average(n) line. Hovering the pointer
over the n of this line will display n's current value.
"Step" again to go into the average routine.
|
We're interested in
the value of total and i. If you click on each of these
with the right button and pick the Display option you'll be shown
the value of these variables in the top panel. When you continue
Stepping through the code you'll see the arrow going around the loop
and the variables' values changing. You'll be able to see when total's
value goes wrong (i goes from 0 to 3 inclusive, so 4 elements
are added together, though only 3 were set).
|
 |
 The commands already introduced may be all you need for the time being if
you're using short programs. Watching how the arrow moves may alert you
to situations where the control flow is unexpected, and the ability to
observe particular variables saves you having to put extra cout
commands in your program. Two tips -
The commands already introduced may be all you need for the time being if
you're using short programs. Watching how the arrow moves may alert you
to situations where the control flow is unexpected, and the ability to
observe particular variables saves you having to put extra cout
commands in your program. Two tips -
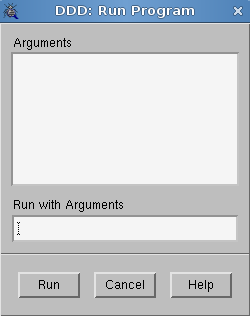
- If you need to provide arguments, use the Run ... menu option
- If you hover the pointer on
an expression like num[i] you'll be shown the value of num
(a memory address) or i. To get the value of num[i] highlight it first.
As your programs grow in size, stepwise execution will become more tedious.
You need ways of being more selective in your investigations. You can set
breakpoints in particular routines, and take bigger steps that don't show
what happens in function calls. Browse through the menus to get an idea of
the other facilities available.
You'll never use most of them, but it's nice to know that they're there.
Note that ddd copes happily with multiple
source files even if they're in different languages.
C++ has all of C's potential for bugs, plus some additions of its own, so
this section is also useful for C++ programmers.
Judicious use of print statements can be the best way to work. Remember however that standard output is buffered, so it might not appear on the screen straight away. Using endl in C++ will force output to the screen. Alternatively, use cerr in C++ (fprintf(stderr, ... in C) which is unbuffered. Using the error channel is useful also because you divert the debug output from the normal output. If your program is called foo then on Unix
./foo 2>errorlog
will put the error output (but only the error output) into a file called errorlog.
Debug output can become so voluminous that it defeats its purpose. The preprocessor offers some features to control the quantity of output and provide more detail. The code below shows
- how to use __LINE__ and __FILE__
to display information.
- how to keep debug lines in the code without running them every time. Removing the definition of the DEBUG symbol will stop the first debug line appearing. Finer control is provided by the other mechanism shown here - by changing the value of DEBUGLEVEL you can make only certain, important debug messages appear.
#include <iostream>
using namespace std;
#define DEBUG
#define DEBUGLEVEL 100
int main() {
int i = 5;
#ifdef DEBUG
cerr << "This is a debug statement on line " << __LINE__ << endl;
#endif
#if DEBUGLEVEL > 50
cerr << "This is an intense debug statement in file " << __FILE__ << endl;
#endif
}
See
Features available will depend on the version you have. The Teaching System's
g77 compiler has a -g option (so you can use ddd
on the resulting executable) and various options (e.g. -Wall
to provide more warnings). The following
options are sometimes available too
-
lintfor detects erroneous, non-portable, or wasteful use of the
fortran77 language. It pays particular attention to mismatches between calls
and definitions of functions, etc. See the online man page for details.
- Putting $SYMTABLE on at the top of a file will cause the compilation to
print out extra information about variables: their type and size.
-
Putting $RANGE on at the top of a file should cause the resulting program
to print messages when array bounds are violated.
-
PRINT statements are useful debugging aids. If such lines have a D in
column 1, then you can choose whether you want to compile them or not
by adding `$DEBUG on' or `$DEBUG off' to the source file.
-
Compiling with the +T option makes the resulting program print more
information should it crash, telling you for example where and why
a floating exception happened.
Mail Pete Clarkson if you have problems. Note that
using Fortran 90 may help reduce errors.
Mathwork's Techniques for Debugging MATLAB M-files is useful.
Web applications may present difficulties because of the number of
components that may be involved. If there's a problem (in particular
performance-related) the cause could be: the network; the database,
the web server
(with modules for PHP support), the web proxy-server or the browser itself
(which comes in various varieties each with different plug-ins, java
interpreters and so on). See
Testing Web applications for some suggestions.
 Some common run-time errors are
-
Segmentation Violation, Memory Fault or
Data Memory Protection Trap -
You are accessing a forbidden part of memory. Perhaps an array
index is beyond bounds or there's a parameter mismatch when a
subroutine's called. Expect the unexpected!
-
Bus Error -
This usually means that you are accessing misaligned data (for example,
trying to access an integer from an odd address), but can
also be caused by mis-assigned variables.
-
Floating point exception -
Division by zero or values which are too big or small may cause
this message to appear.
Your program may also crash if it unexpectedly hits a limit of some kind.
- Many systems limit the amount of disc space you can use. Sometimes,
even if you are under quota, the disc is full. In such situations
writing to, or creating, a file will fail. Programs should be written
so that they can cope with these situations.
- Some systems impose a limit on the size a program can grow to.
Some programs which create big arrays (Matlab, for
example) can reach this limit. Run top in a separate window
to monitor the size of your program if you think it might be reaching
this limit.
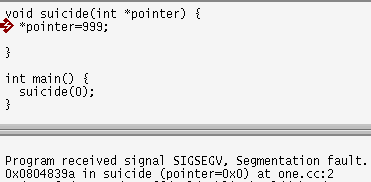 The error message won't usually tell you the line that caused the
crash, or even the function that the line's in, but if you run the program
within a debugger, you'll get
more information. For example, the program on the right tries to write to
memory starting at 0. Running the program in ddd shows you the
last line executed and lets you find out variable values.
The error message won't usually tell you the line that caused the
crash, or even the function that the line's in, but if you run the program
within a debugger, you'll get
more information. For example, the program on the right tries to write to
memory starting at 0. Running the program in ddd shows you the
last line executed and lets you find out variable values.
If a program runs into serious problems it may crash, giving a
Core Dumped message. This means that a big file called core
may be created in the directory from where you ran the program. It may even do
this before it reaches the first line of executable code.
The resulting core file can be investigated
using adb program can be used
even if you haven't compiled using the `-g'
flag. If a program called testing crashes, typing
adb testing, then $c will give a backtrace of routines called, whichmay help you localize the bug. Get out of adb using $q.
Some bugs cannot be reliably provoked. The effect of some bugs is
random - sometimes the program will continue running, sometimes it
won't. Sometimes the bug "goes away" if you add some cout
statements to debug the code, or if you recompile with the -g
flag as preparation for using the debugger. This could be because
- the bug in the program causes the code to be over-written. If
the layout of the code changes, a different (perhaps less vital)
piece of code is overwritten
- the compiler changes its behaviour. There's
no requirement in the C++ specification for a variable like total
in the example above to be initialised to 0, though compilers sometimes
do so, depending on the command-line options .
2 common causes of crashes relate to memory
- Illegal access - when you try to access memory that isn't yours,
or doesn't exist
- Leaks - when a routine claims memory that it doesn't free.
If the routine is called many times, the program may grow until until
it pops.
Tools exist to help detect these problems. One example is
Valgrind which works on x86-based
linux systems (CUED's teaching machines for example). It includes
Memcheck
which can detect
- Use of uninitialised memory
- Reading/writing memory after it has been freed
- Reading/writing off the end of malloc'd blocks
- Reading/writing inappropriate areas on the stack
- Memory leaks -- where pointers to malloc'd blocks are lost forever
- Mismatched use of malloc/new/new [] vs free/delete/delete []
etc. If the following program is compiled to produce a program called
testing
#include <stdlib.h>
#include <stdio.h>
#include <string.h>
int main() {
char *str1=(char*)malloc(5);
char *str2=(char*)malloc(5);
strcpy(str2,"four");
strcpy(str1,"twelve bytes");
printf("str1=%s\n", str1);
printf("str2=%c\n", str2);
}
then
valgrind testing
will produce a lot of output, including things like
Address 0x1BB50034 is 7 bytes after a block of size 5 alloc'd
...
LEAK SUMMARY:
definitely lost: 10 bytes in 2 blocks.
etc.